Ask the market. Every number is computed, not guessed.
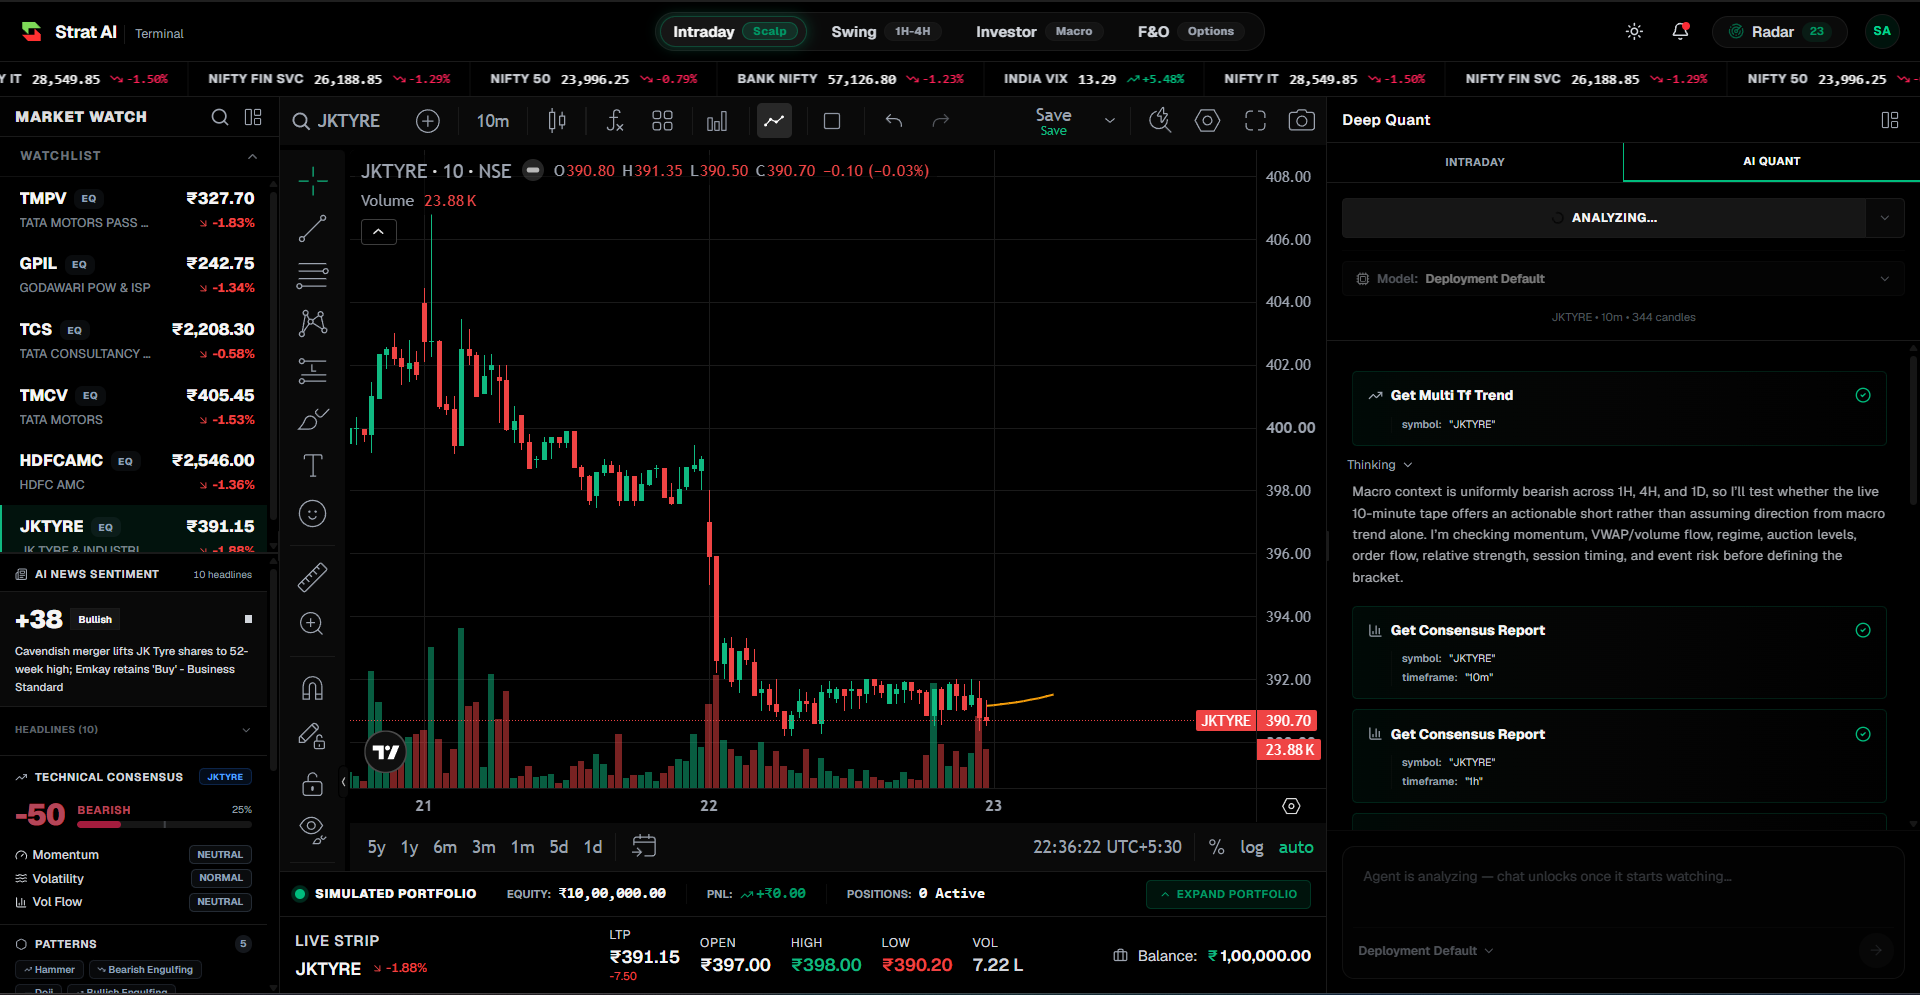
Strat AI is a market analysis and pre-trade risk terminal for the NSE. Ask about a symbol in plain language and it calls eighteen typed quantitative tools over MCP, streams every call to your screen as it happens, and tells you when not to trade.
Analysis and pre-trade risk research only. Strat AI does not place orders, hold funds, or provide financial advice.
Your question.
A whole market behind the answer.
Not just a chat window. Watch the agent turn stock context into tool calls, read backend measurements, and build a trade plan. Then ask a follow-up and watch the loop run again.
 STRAT AI CO-PILOT EXPLAINED INTERACTIVE DEMO / NO LIVE DATA
Not a chatbot. A co-pilot.
The model reasons. The tools measure. You decide.
+ market context
modelREASONING
- Multi-timeframe trendREPLAY
- Signal consensusREPLAY
- Market regimeREPLAY
- MomentumREPLAY
- Relative strengthREPLAY
- Price actionANALYSIS
- Volume profileREPLAY
- Market liquidityREPLAY
- Options chainANALYSIS
- Options GreeksANALYSIS
- Candlestick dataANALYSIS
- Order flowANALYSIS
- Support & resistanceREPLAY
- ATR & volatilityREPLAY
- Trade validationREPLAY
- Risk / rewardREPLAY
- Set contextCONTROL
- Agent responseCONTROL
dataBACKEND
For illustration only. Not investment advice. Trading involves risk.
FIND, DEBATE and QA are shown here as existing terminal capability. VERIFY is the mode you can point at your own levels today. This is a simplified demonstration; real runs can also return HOLD or unavailable data.
Bring your own trade. It will try to break it.
Give it an entry, a stop and a target. Before any model reasons about your thesis, five deterministic checks run in a fixed order. A failure is a rejection with a machine-readable reason tag — not a softened suggestion, and not a silently resized position.
- A stop floor no profile can relax
- Your stop distance must be at least 1.5× ATR(14). That constant holds for intraday, swing, investor and F&O alike. A stop sitting inside normal market noise is rejected, not renegotiated.
- Reward-to-risk floors that fit the session
- 1:2 for swing, investor and F&O. 1:1.3 for intraday — because a swing-calibrated floor makes a defensible intraday bracket arithmetically impossible and yields nothing but perpetual holds.
- Then something argues against you
- A Bear agent runs against your own proposal, hunting for overhead VWAP capping the move, call open-interest walls above your target, volume-profile gaps and unfavourable session timing. It returns a critique and nothing else — it has no authority to decide.
- Rejections you can act on
- Eight stable failure tags, not prose: missing levels, inconsistent direction, stop too tight, reward-to-risk too low, leg fraction out of range, target ordering inconsistent, breakeven out of range, blended reward-to-risk too low.
- Written twice, on purpose
- The validator exists in Rust and again in Python with identical constants and identical reason tags. The arithmetic is not something a language model can talk its way around.
Multi-leg exit plans are validated as a whole: leg fractions must sum correctly, targets must order correctly, the breakeven trigger must sit between entry and first target, and the blended reward-to-risk must still clear the floor.
- Direction
- BUY
- Entry
- 1,298.50
- Stop
- 1,291.00
- Target
- 1,316.00
- ATR(14)
- 18.90
- Floor (1.5× ATR)
- 28.35
- Levels present and finiteOK
- Direction ordering — stop < entry < targetOK
- Stop distance ≥ 1.5× ATR(14)7.50 · needs 28.35
- Reward-to-risk ≥ 1:1.3not reached
A rejection is not a resize. The stop floor holds for every profile.
- Overhead VWAP at 1,304.20 caps the path to your target
- Call open-interest wall concentrated at the 1,300 strike
- Midday session phase — historically thin and choppy
Advisory only. The Bear agent cannot commit, block, or override a decision.
Four projection models, free to disagree with each other.
Most terminals draw one forward line and let you assume it means something. Strat AI runs eight projection engines, four of them selectable directly on the chart, each using genuinely different mathematics. Switch model and the line changes — which is the entire point. A projection you cannot cross-examine is decoration.
- OLS — unweighted least squares
- A straight line fitted across a fifty-bar window, then re-anchored onto the last close. The baseline case, where every bar counts the same regardless of what traded.
- VWLR — volume-weighted least squares
- The same straight-line model, weighted by traded volume with weights floored at one, so bars where size genuinely changed hands pull the fit harder than quiet ones do.
- VWEPR — volume-weighted quadratic
- A curve rather than a line, solved by Gaussian elimination with partial pivoting and falling back to OLS if the system turns out singular. Quadratic and not cubic on purpose — a cubic flies off the screen. Its second-order term is surfaced as an acceleration coefficient.
- FCST — regime-conditioned forecast
- Not a regression at all. An exponentially weighted drift over log returns, then conditioned on the measured regime: amplified in a trending market, damped in a ranging one. It reports a direction, an up-probability, an expected move in ATR units and its own confidence.
The fifty-bar window is pinned to the same constant the agent’s own tools use, so the projection you see and the projection it reasons about cannot drift apart. R-squared is reported only by the dedicated predictive model that actually computes it, and only on the ten-minute chart it was calibrated for.
Unweighted least squares · straight line
- Fit basis
- every bar equal
- Re-anchored to
- last close
- Confidence
- not reported
Projection length tracks zoom — twelve percent of visible bars, clamped between three and twenty, counted in actual bars so overnight and weekend gaps do not stretch it.
R-squared comes from the dedicated ten-minute predictive model, not from these four fits.
It notices the move before the newswire explains it.
A separate service watches ten-minute candles for a two percent absolute move. When one fires it asks a model for a cause, then publishes a headline, a written read and a sentiment assessment straight into the terminal — shaded harder once the move clears three percent.
- Distinct from the news scorer
- This is not headline sentiment wearing a different label. It triggers on price behaviour first and reaches for explanation second, which is why it can surface a move that has not reached a feed yet.
- Its own structural pass
- The same service runs a hundred-candle pattern engine against a pinned four-field contract: type, sentiment, description, and a confidence clamped between zero and one.
- No cause, no story
- When nothing explanatory can be found, it reports exactly that. It will not assemble a plausible narrative to keep the panel looking populated.
- Pushed, not polled
- Insights are broadcast to the terminal as they are produced, so the commentary lands while the candle still matters.
Bid steps up as volume expands off the value-area low
Price cleared the prior ten-minute range on expanding volume, with no scheduled event inside the window and no matching headline on the feed yet.
- Trigger threshold
- ≥ 2.00% absolute
- Escalated shading
- ≥ 3.00%
- Source stream
- 10-minute candles
When no explanatory cause can be found, the panel reports that instead of generating a narrative.
Three layers, and the middle one is arithmetic
A language model asked to read a chart will produce a confident number whether or not one exists. So it is never asked to. Measurement and reasoning are separate layers here, and the boundary between them is a typed tool contract.
Ingested raw, decoded in Rust
Exchange binary frames are decoded field by field — no JSON, no REST polling — with five levels of book depth in full mode. Open interest stays an optional value and is reported absent on packets that never carried it, rather than defaulted to zero.
- BINARY TICK FRAMES
- FIVE-LEVEL DEPTH
- DUAL SINK
- OPTION CHAIN SNAPSHOTS
Deterministic functions do the arithmetic
Indicators, pivots, volume profile, the pattern engine, the projection fits and the risk validators are pure, property-tested modules. A value that could not be measured is emitted as null, and a state that could not be measured reads UNAVAILABLE — which is a different finding from NEUTRAL.
- 26 PATTERN LABELS
- POC · VAH · VAL
- 1.5× ATR VALIDATOR
- UNAVAILABLE ≠ NEUTRAL
MCP hands those numbers to the reasoning layer
Each computation is exposed as a typed tool. The agent calls it and reasons about what comes back, and every payload is contract-checked on the way through — so a tool cannot return an invented value even when a model would prefer one.
- 18 TYPED TOOLS
- CONTRACT VALIDATION
- THREE TOOL BINDINGS
- GLASS-BOX STREAM
The model never invents a number.
Every figure the terminal puts on screen came out of a deterministic function and reached the model as a typed tool result. That is why a missing feed shows up as unavailable instead of as a plausible-looking value, and why the reasoning can be audited line by line rather than taken on trust.
What sits underneath the four headline features
The measurement layer the Co-Pilot calls, and the surfaces you can read directly without asking it anything.
Patterns, completed and forming
Twenty-six pattern labels across five categories — reversal, continuation, bilateral, harmonic and institutional — each carrying a derived confidence and a volume-validation verdict. A second pass reports patterns still forming, with a progress estimate, using a provisional swing at the current bar.
Order flow, measured not assumed
Tick-level order flow imbalance signed by the tick rule and refined by quote location wherever a usable bid and ask exist. Below the minimum tick count it returns nothing rather than a neutral zero. Footprint cells carry bid- and ask-initiated volume at every price level.
Volume profile, mirrored twice
Point of control, value area high and low at seventy percent of traded volume, plus high and low volume nodes. Implemented independently on both sides on purpose, so the levels the agent reasons about are the levels drawn on your chart.
F&O options analytics
Black-Scholes pricing, implied volatility solved by bisection, the full Greeks, put-call ratio, max pain, open-interest buildup quadrants, OI walls and futures basis. Six signals vote on positioning bias, and at least two must agree before it will say anything at all.
Four workspaces
Intraday, Swing, Investor and F&O. Each carries its own reward-to-risk floor, its own sidebar, its own remembered instrument and its own tool binding. Split view is granted only where it makes sense, and that is enforced in the store rather than merely hidden in the interface.
Regime, session and relative strength
Trend state and volatility state as an orthogonal pair rather than one flattened label. Seven NSE session phases with expiry-aware favourability. Relative strength against a resolved benchmark, time-aligned with no lookahead. Scheduled-event proximity that can only tighten a setup, never loosen one.
One session, from pre-open to journal
Not a promise about outcomes. A description of which surface answers which question, in roughly the order a trading day tends to ask them.
Establish the regime before the bell
Trend state is reported against volatility state as two separate readings, alongside the session phase ahead and whether a scheduled event falls inside the horizon. A ranging regime is classified unfavourable — which is information available before anyone has an opinion.
Let the structure print
The opening range is taken from the first fifteen candles. Volume profile fills in the point of control and the value area, and the pattern pass reports what is still forming as well as what has completed.
Price the idea before committing to it
Entry, stop and target go into VERIFY. Either the arithmetic clears the 1.5× ATR floor and the reward-to-risk floor for that profile, or it returns rejected with the tag naming the check that failed.
Watch a level instead of a screen
A price condition can be armed, at which point the run suspends. The tool server watches live ticks and resumes the analysis when the level actually trades, so re-evaluation is triggered by the tape rather than by refreshing.
Find out whether the read held
Committed decisions are scored against the candles that followed — target first, or stop first. Expectancy accumulates per setup type, and a setup type showing negative expectancy is required to reduce conviction rather than merely noted somewhere.
Every step above describes terminal behaviour. None of it is a recommendation, a signal, or a statement about what any trade will do.
Engineered constraints, not results
Watch it think — every tool call, every number, every reason, streamed live to your screen. When data is missing, the system reports it as unavailable rather than filling the gap with a guess.
These are design constraints, not performance figures. Strat AI is a market analysis and pre-trade risk research tool: it does not execute trades, manage funds, or provide personalised financial advice, and nothing it produces forecasts a return.
The most useful thing about this terminal is the list of things it cannot do
Most of what makes an analytics tool trustworthy is capability its authors deliberately did not build. Ours is enforced in code and asserted by tests, rather than promised in a policy document.
- It cannot place an order
- The broker layer exposes quotes, instruments and search. There is no order method to call. A test maintains a denylist — place order, execute trade, cancel order, modify order, submit order, close position, square off — and asserts every one of those names is absent, so the boundary fails the build the moment it is crossed.
- It cannot fill a gap with a guess
- Values that could not be measured are emitted as null, never as zero. A momentum state that could not be computed reads UNAVAILABLE rather than NEUTRAL, because "measured and unremarkable" and "could not be measured" are different findings, and both the interface and the model read the answer as one.
- It cannot answer a question about you
- A deterministic guardrail runs before the model is invoked and refuses eight categories outright: position sizing, holdings, capital, income, net worth, goals, third-party requests and suitability. Because that refusal is arithmetic rather than a line in a prompt, it cannot be talked around and it reproduces identically years later.
- It cannot show you a win rate
- Total return, win rate, maximum drawdown and average conviction were removed from the dashboard. What replaced them is setups audited, setups rejected and forced holds — with an em-dash wherever a number has not actually been measured. The internal calibration loop still tracks expectancy; no endpoint publishes it.
- It cannot quietly change its mind
- Every committed decision is written to an append-only, hash-chained record carrying the model identifier and the prompt version that produced it. There is no update or delete path, so any output can be replayed later and shown to be unaltered.
The same engine, pointed at a market that never closes
A separate product rather than a region toggle. On-chain structure and perpetual funding behave nothing like an equity session, and a session engine built around a 09:15 open does not transfer for free.
- Continuous sessions
- Separate microstructure research
- Distinct risk calibration
In development. No release date, no feature commitments, and nothing described here is available to use today. Strat AI currently covers Indian equities and equity derivatives only.
Talk to the teamTransparent, credit-based plans
Transparent plans designed for active Indian options, futures, and equity traders. Zero hidden costs.
- 500 Strat AI Compute Credits
- VERIFY pre-trade risk audit (1.5× ATR floor)
- News sentiment & anomaly commentary
- F&O options chain analytics (max pain & OI walls)
Essential trading tools with core market insights and features to get started.
SELECT PLAN- 1000 Strat AI Compute Credits
- VERIFY pre-trade risk audit (1.5× ATR floor)
- News sentiment & anomaly commentary
- F&O options chain analytics (max pain & OI walls)
Basic plan with Deepseek GLM model access
SELECT PLAN- 2000 Strat AI Compute Credits
- VERIFY pre-trade risk audit (1.5× ATR floor)
- Adversarial Bear Agent critique
- Ghost Line projections (OLS, VWLR, VWEPR, FCST)
- Credit top-ups enabled
- News sentiment & anomaly commentary
- F&O options chain analytics (max pain & OI walls)
Pro plan with Multi-model comparison, Ghostline projection and Top-ups
SELECT PRO PLAN- 4000 Strat AI Compute Credits
- VERIFY pre-trade risk audit (1.5× ATR floor)
- Adversarial Bear Agent critique
- Ghost Line projections (OLS, VWLR, VWEPR, FCST)
- Footprint & order flow imbalance
- Credit top-ups enabled
- News sentiment & anomaly commentary
- F&O options chain analytics (max pain & OI walls)
Maxx plan with Footprint charts and all premium features
SELECT PLANSubscription credits are consumed for computing analytical queries, trajectory projections, and multi-agent research runs. Strat AI does not execute trades, manage funds, or offer personal financial advice.
Latest market research & strategies
Stay informed with disciplined quantitative research and market insights from our Trading & Research Wing.
Frequently asked questions
What exactly is Strat AI?
A market analysis and pre-trade risk terminal for Indian equities and equity derivatives (NSE/BSE F&O), built by the Trading & Research Wing. It evaluates setups, audits them against deterministic risk floors, decodes order flow and options positioning, and streams its reasoning while it works. It does not place orders, hold funds, or provide advice.
What can I ask the Co-Pilot, and what does it actually call?
Ask about a symbol in plain language. The reasoning loop has eighteen typed tools available over MCP: candles, a full indicator consensus, multi-timeframe trend, chart patterns, support and resistance, volume profile, news context, projections, market regime, relative strength, order flow, forecasts, session context, options analytics, event risk and its own track record — plus two control tools for arming a price watch and committing a decision. Every payload is contract-validated before the model is allowed to read it.
How does VERIFY decide a setup is unacceptable?
Five deterministic checks in a fixed order: levels present and finite, direction consistent with those levels, stop distance at least 1.5× ATR(14), and reward-to-risk at or above the floor for the profile — 1:2 for swing, investor and F&O, 1:1.3 for intraday. Checks stop at the first failure and return a stable reason tag. Setups below the floor are rejected outright, not silently resized. The validator is implemented twice, in Rust and in Python, with identical constants.
Why are there four Ghost Line models?
Because they answer slightly different questions, and disagreement between them is itself information. OLS is an unweighted straight-line fit. VWLR weights that same fit by traded volume. VWEPR fits a volume-weighted quadratic and surfaces its acceleration term. FCST is not a regression at all but a regime-conditioned drift forecast reporting an up-probability and an expected move in ATR units. All four use a fifty-bar window pinned to the same constant the agent’s tools use. R-squared is reported by the one dedicated model that computes it, on the ten-minute chart it was calibrated for.
How many chart patterns does the engine detect?
Twenty-six completed pattern labels across five categories: eight reversal, six continuation, four bilateral, five harmonic and three institutional. Each carries a confidence and a volume-validation verdict, and several detectors withhold a pattern entirely rather than emit it with a weaker score when it fails its volume filter. A separate pass reports patterns still forming, with a formation-progress estimate.
What does the conviction score mean?
It is a relative ranking of setup quality from 1 to 100 within our own framework. It is not a probability, a win rate, an expected return, or an instruction to buy or sell anything. The fusion is more than a single rule: the base blend weights technical momentum at 70% and news sentiment at 30%, but a sentiment conviction above 85 inverts that to 30/70, on the reasoning that strong news breaks technical patterns. A separate conflict rule pulls the blended score 60% toward neutral when a strongly bearish technical read meets strongly bullish news — that rule is asymmetric, applies only in that direction, and is suppressed while the inversion is active.
Is this financial advice, and can it trade for me?
No to both. Strat AI is analysis and risk tooling, and is not a SEBI-registered investment adviser. The broker seam is read-only: there is no order method to call, and a test asserts the absence of every order-placement name. A deterministic guardrail additionally refuses questions about your capital, holdings, position size, income or suitability before the model is invoked, because impersonal research is what the product is.
What happens when a data feed goes down?
The tool returns an explicit unavailable marker and the run reports it as unavailable. Unmeasurable numbers are emitted as null rather than zero, and a state that could not be computed reads UNAVAILABLE rather than NEUTRAL. Nothing is interpolated or substituted to keep a panel looking complete.
Do you publish win rates or backtests?
No. Total return, win rate, maximum drawdown and average conviction were deliberately removed from the dashboard, and no endpoint exposes them. What the terminal reports instead is discipline: setups audited, setups rejected, forced holds, and an em-dash wherever something has not been measured. Realised expectancy is still tracked internally, and is used to calibrate conviction downward on setup types that have not earned it.
Audit a setup before you fund it
Strat AI is in private beta with a deliberately small group of traders working the Indian markets. If you care more about why than what, we want you in it.